← Back to blog Faro
Faro
28 Sept 2026
How to Read the Hyperliquid Long/Short Ratio
FaroFaroShould I be long or short right now? That is the question everyone wants answered, but the long/short ratio cannot answer it. It does not tell you which way to trade, it tells you how everyone else is already positioned.
That is still useful. If you know which side is crowded, you know where the liquidation risk sits. On Hyperliquid, you can see this more clearly than on any other venue, because every position sits onchain.
This guide covers how the ratio is calculated, the three versions you will see, why the Hyperliquid ratio is different, and where the ratio misleads.
The long/short ratio compares long positioning to short positioning in a perpetuals or futures market, measured by number of accounts or by position size. It shows which side the crowd leans towards at that moment.
The formula for calculating the long/short ratio is: long/short ratio = longs / shorts
Above 1.0 means more accounts are long than short, and below 1.0 means more accounts are short than long. Near 1.0 means positioning is balanced.
Example: Say 62% of Hyperliquid addresses with an open BTC position are long, and 38% are short.
Ratio = 62 / 38 = 1.63
That means there are 1.63 long accounts for every short account, or 63% more long accounts than short. On its own, that number could be read as bullish crowding. If you pair it with positive funding though, it shows the longs are paying to stay in the trade, which is a common setup for a long squeeze if the price of BTC stalls.
No. On a perpetual venue, every long position has a short position sitting on the other side, so total long size always equals total short size. That total is open interest. The ratio does not measure how much exposure exists, it measures how that exposure is split.
To read any long/short ratio, check two things: how it is weighted, and which traders it covers.
On a centralized exchange, you get whatever number the exchange reports. You cannot check its method, and you cannot see who sits behind it.
On Hyperliquid, every address's positions are public, including size, entry price, leverage, and liquidation price. That means the ratio is calculated from raw positions, not from a figure the venue chooses to publish. You can also see who is on each side, not just how many. You can split the crowd by size, leverage, or profit and loss, and see whether the largest wallets agree with everyone else.
There is one catch. An address is not a person. One trader can run many addresses, subaccounts, and vaults, which can inflate the account count on one side.
If you pull up the BTC long/short ratio on Hyperliquid, Binance, and Coinglass at this moment, you will see three different numbers.
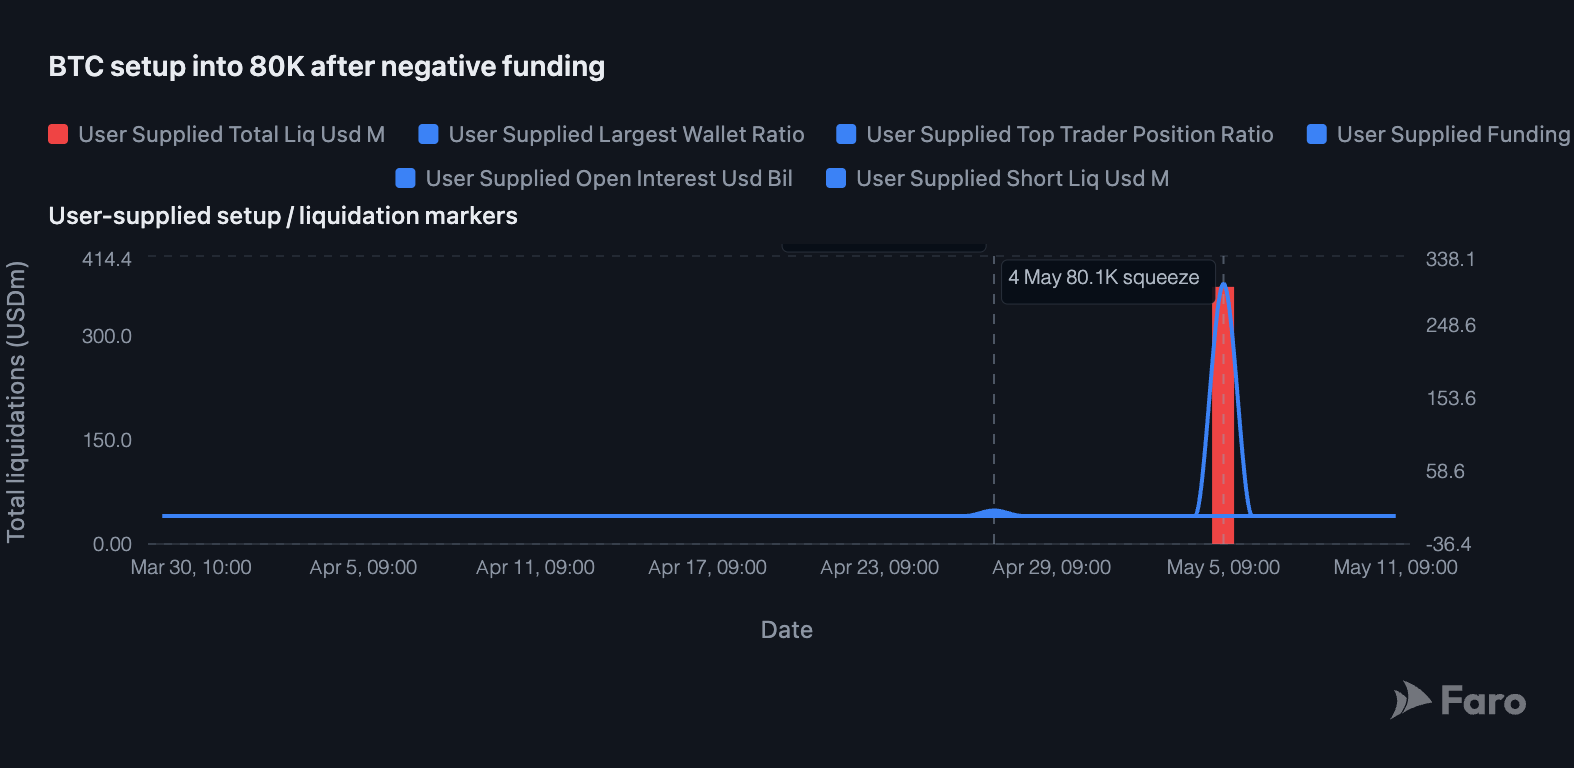
On April 26th, 2026, Hyperliquid’s largest wallets sat at a position ratio of 2.04, meaning more accounts were long than short. The top-trader position ratio told a different story, leaning short at 0.50.
Funding was -0.14%, and open interest sat around $7.3B, which meant shorts were paying to hold their position. This came off BTC’s 6 week price climb from $65k to $79k that left shorts exposed if price continued to break higher.
8 days later, on May 4th, BTC broke above $80k for the first time since January, and $370M in total crypto liquidations hit within 24hrs, with $301.9M of that from short positions. BTC futures open interest climbed sharply, as fresh capital came in following the move.
To summarize, most accounts were long, but most of the biggest traders' money was short. So if you only checked the account ratio, you might have bet against the crowd and gone short too. Looking at the position ratio and funding together showed the real risk: the biggest traders were short, and they were paying every hour to stay that way, which set up the conditions for a short squeeze.
The long/short ratio can mislead because it counts positioning labels, not intent, and it does not tell directional trades apart from hedges. Market makers may hold large exposure on one side while offsetting the risk elsewhere, and basis traders can be short perps against spot without holding a bearish view.
On Hyperliquid, one trader spread across many addresses can also skew the account ratio. The position ratio for a cohort helps here, because it weights by size, not by count.
The signal is useful for spotting crowding and positioning context, but it should not be used as a timing tool unless price, funding, open interest, and flow confirm it.
You can track long/short ratios on exchange dashboards for venue-native reads, and on aggregators for cross-exchange context.
A ratio moving by itself can just be noise, but a ratio moving with funding, OI, and price tells you positioning is changing. With Faro Alerts, you can be notified when the long/short ratio extreme is heavily skewed long or short in real time, allowing you to act on trading opportunities as soon as they happen.
Set your Faro long/short ratio extreme alert
How is the long/short ratio calculated?
Long/short ratio = longs / shorts. Above 1.0 means more accounts are long, below 1.0 means more are short, and near 1.0 means positioning is balanced.
What is a good long/short ratio?
There is no good ratio. Near 1.0 means positioning is balanced, and an extreme in either direction means one side is crowded. What the ratio means depends on funding, open interest, and price.
Is the long/short ratio the same on Hyperliquid, Binance, and Coinglass?
No. Hyperliquid positions are on-chain, so the ratio is calculated from public data. Binance only shows its own users. Coinglass aggregates many venues, each with its own method. Because of this, the numbers do not match.
What is the top trader long/short ratio?
It measures how the largest traders on a venue are positioned. On Binance, it covers the top 20% of accounts by margin balance. On Hyperliquid, you can build the cohort directly from on-chain positions.
Does a high long/short ratio mean price goes down?
No. A high ratio shows that one side is crowded, not that price goes down. A high ratio by itself is not a timing signal. The rule is:

Join our 30-day trading contest and receive 30 days of Faro Pro free (worth $249), including unlimited credits and advanced market intelligence.
Not interested in the contest?