← Back to blog Faro
Faro
9 Oct 2026
Fed Net Liquidity: Live Chart, Formula and What It Means for Bitcoin
FaroFaro
Fed net liquidity is the amount of liquidity available or circulating in financial markets, after accounting for the Federal Reserve and Treasury items. Since Bitcoin tends to rise and fall with the supply of the dollar, traders typically use net liquidity to gauge if macro conditions are supporting or pressuring Bitcoin and other risk assets.
Fed net liquidity is built from:
The formula to calculate the Fed net liquidity is:
Net liquidity ($M) = WALCL - WDTGAL - RRPONTSYD
FRED publishes all three inputs:
| Input | FRED series and ID | Units | Frequency |
| Fed total assets | WALCL | Millions of USD | Weekly on Wednesdays |
| Treasury General Account | WDTGAL | Millions of USD | Weekly on Wednesdays |
| Overnight reverse repo | RRPONTSYD | Billions of USD | Daily |
| Input | Reported Value | In millions |
| Fed total assets (WALCL) | 6,655,939 | 6,655,939 |
| TGA (WDTGAL) | 875,833 | 875,833 |
| RRP (RRPONTSYD) | 0.698 (biilion) | 698 |
Net liquidity = 6,655,939 - 875,833 - 698 = 5,779,408
Fed net liquidity on the week of March 18th, 2026 was $5.78 trillion.
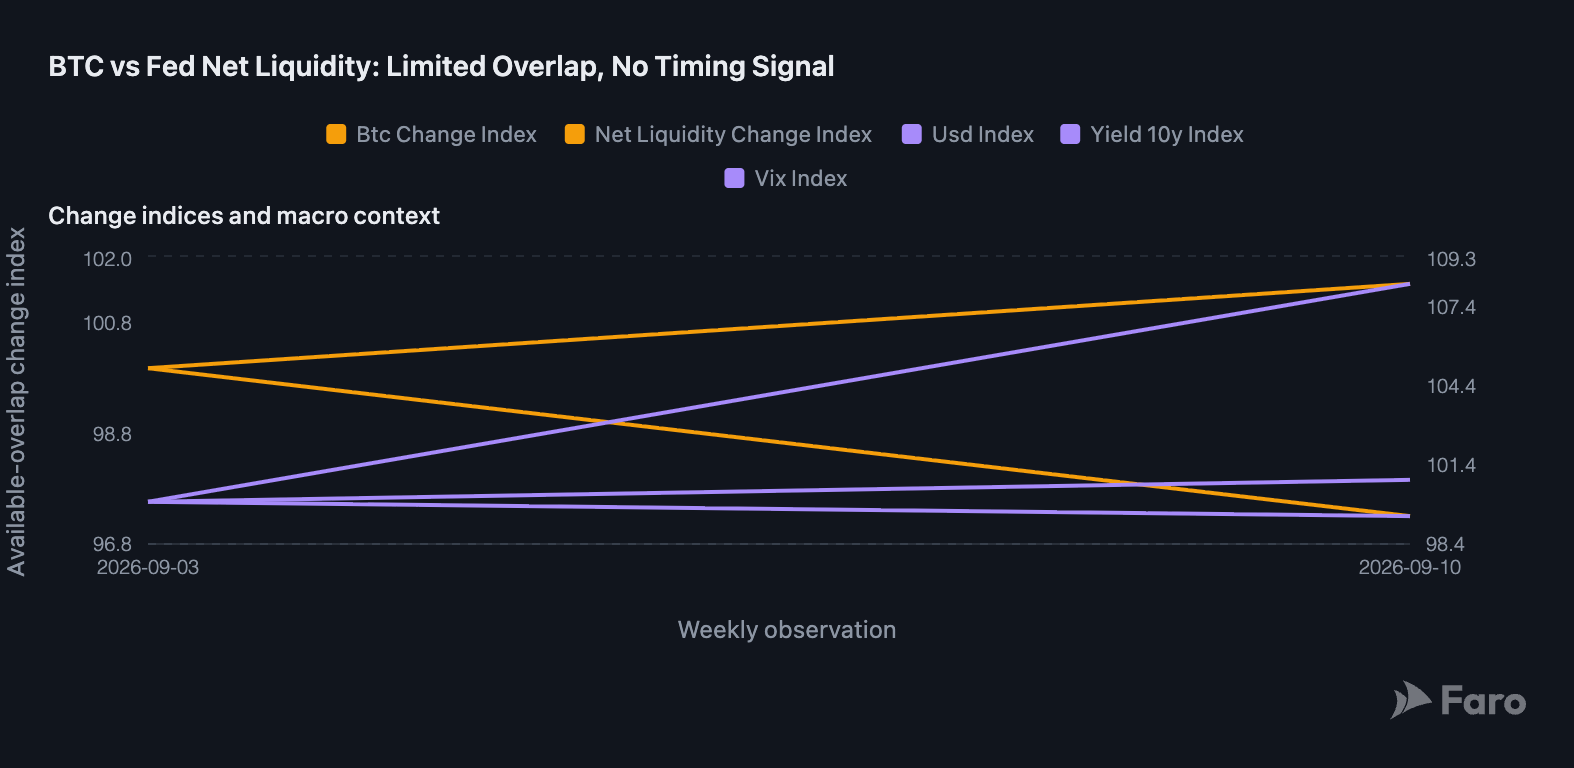
Between September 3rd to September 10th, 2026, net liquidity and Bitcoin moved in opposite directions. Bitcoin’s indexed weekly close fell from 100.0 to 97.3, while net liquidity rose from 100.0 to 101.5. At the same time, the VIX index, which measures expected market volatility, jumped from 100.0 to 108.3, meaning investors were nervous, and the 10-year yield index edged up from 100.0 to 100.8, indicating that risk conditions were more restrictive even as the balance sheet improved.
This shows the main limit of net liquidity, it tracks Fed and Treasury plumbing, not whether investors want to buy Bitcoin. For liquidity to lift the price, it typically needs to arrive alongside real demand for Bitcoin. In this window, liquidity improved while nearly everything else moved in the opposite direction.
Net liquidity is best treated as one input, not a timing signal. It is a good indicator to tell whether the background is helping or hurting risk assets, but it cannot tell you when you should buy or sell. It is better to pair net liquidity with measures of actual demand for Bitcoin such as ETF flows and the Coinbase premium. When liquidity, ETF flows, and the premium are all moving in the same direction, then the signal is much stronger than when reading each of them on their own.
One pattern traders should watch for is the hollow rally, where Bitcoin hits a new high while net liquidity hits a lower high. In these instances it suggests that the price is climbing without the cash backing the move, making the rally fragile. It is also important to know the events that drain liquidity such as TGA refills and QT pace changes. A TGA refill happens when the Treasury rebuilds its cash balance after a debt-ceiling deal, pulling cash out of the market. QT has a similar effect when its pace speeds up, because the balance sheet shrinks more quickly.
Kevin Warsh, the Fed Chairman, has long argued for a smaller balance sheet, having criticised the post-crisis growth of the Fed’s footprint. He holds the view that the balance sheet remains larger than necessary, which argues the point against open-ended QE as a normal policy tool.
A smaller Fed balance sheet is usually a net liquidity headwind for Bitcoin. A lower WALCL pulls net liquidity down unless the TGA or RRP fall by the same amount, and there is little room left to offset it. The RRP stood at roughly $2B on October 7th, 2026, down from just under $2 trillion at the end of 2021. The Fed has learned what happens when it shrinks too much. In 2019, the balance sheet reduction cut bank reserves enough to spike overnight lending rates, thereby forcing the Fed to add liquidity back. The net impact on Bitcoin is uncertain at this point, however past data shows liquidity and price do not always move together.
Last updated 07/10/2026
There are three central limitations to net liquidity:
What does net liquidity mean?
Net liquidity is the Federal Reserve money that is actually available to financial markets. It counts everything the Fed owns and subtracts the cash in the Treasury account and the reverse repo facility.
What is Fed net liquidity?
Fed net liquidity is the amount of liquidity available or circulating in financial markets, after accounting for the Federal Reserve and Treasury items.
Does net liquidity predict the Bitcoin price?
No, using net liquidity to predict the Bitcoin price is not reliable. It is better used as a background signal of whether conditions help or hurt risk assets, not a tool for timing trades.
Why does the TGA affect Bitcoin?
The TGA is the Treasury’s cash account at the Fed. When it rises, cash leaves the bank system and net liquidity falls, and when the Treasury spends, cash flows back. This can weigh on risk assets such as Bitcoin.
How does quantitative tightening affect net liquidity?
Quantitative tightening (QT) shrinks the Fed’s balance sheet as bonds mature without being replaced. This lowers net liquidity unless the TGA or RRP fall by the same amount. When the RRP is nearly empty, there is little room left to offset it, so QT hits net liquidity harder than it used to.

Join our 30-day trading contest and receive 30 days of Faro Pro free (worth $249), including unlimited credits and advanced market intelligence.
Not interested in the contest?